

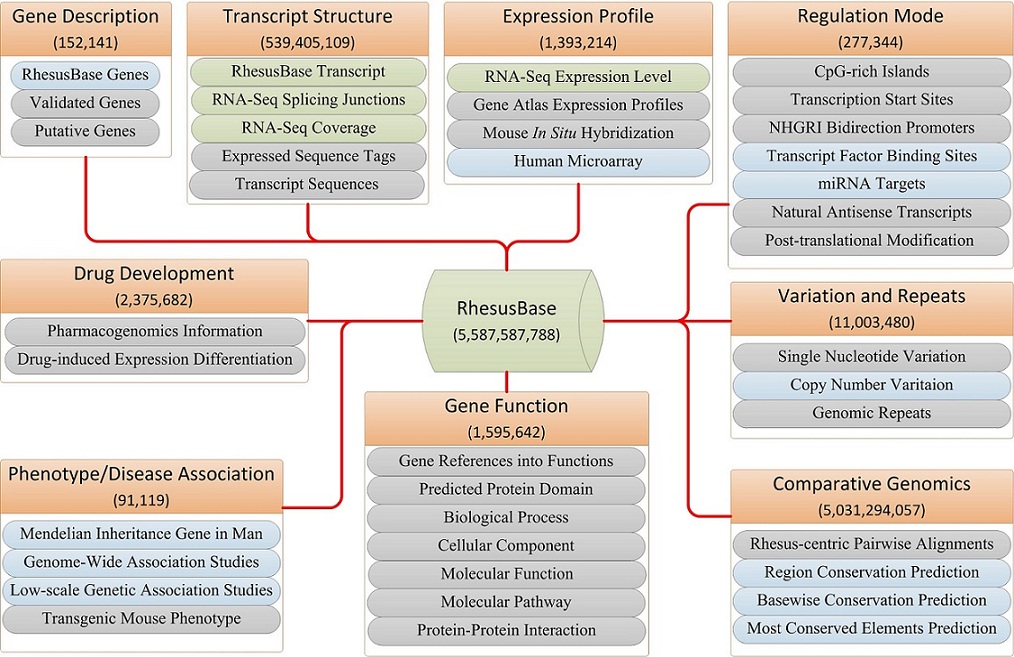
This document illustrates the help information about RhesusBase Gene Page. Nine functional categories of annotations were integrated and standardized, including Gene Description, Gene/Transcript Structure, Expression Profile, Regulation Mode, Variation and Repeats, Comparative Genomics, Gene Function, Phenotype/Disease Association and Drug Development. We also integrated all related annotations in human and mouse for each gene in rhesus macaque, aiming to maximize the understanding of the monkey genome.
- General Information
- Datasets
- Overview
- Dataset Introduction
- Summary
- Structure
- Expression
-
Monkey
- RNA-Seq Human
- RNA-Seq
- BioGPS
- Allen Brain Microarray Mouse
- Brain ISH
- Regulation
-
Monkey
- PTM
- TFBS
- miRNA Target Human
- NATs Mouse
- NATs
- Variation
- Phenotype and Disease
- Function
- Drug
General Information
Assembly version
All annotations for rhesus macaque were compiled and presented on the basis of "Rhesus Jan. 2006 (MGSC Merged 1.0/rheMac2) assembly". "Human Mar. 2006 (NCBI36/hg18) assembly" and "July 2007 (NCBI37/mm9) assembly" were used to present human and mouse annotations, respectively.
Coordinate convention
Coordinates in RhesusBase are shown in the format of chromosome:start-end. All coordinates in RhesusBase are 0-based start except for additional notes.
Section title
For each gene, 8 categories of biological information were shown: Summary, Structure, Expression, Regulation, Variation, Phenotype and Disease, Function and Drug. Main category titles are highlighted in red, primary sub-titles in green and secondary sub-titles in blue.
Datasets
Overview
| Dataset | Organism | ||||
|---|---|---|---|---|---|
| Monkey | Human | Mouse | |||
| Summary | IMM ID | RhesusBase Gene ID | N.A | N.A | |
| Entrez ID | NCBI Entrez Gene ID | ||||
| Human Entrez ID | N.A | Human Entrez Gene ID | |||
| Offical Symbol | Gene Offical Symbol | N.A | |||
| Location | Gene position | ||||
| Type | Gene type | ||||
| Full Name | Full gene name or description | ||||
| Lineage | Lineage of species | ||||
| RefSeq | RefSeq ID related to gene | ||||
| Ensembl | Gene Ensembl ID | ||||
| UniGene | Gene UniGene Cluster ID | ||||
| UniProt | Gene UniProt ID | ||||
| Publications | Publications about this gene | ||||
| Wiki | Wikipedia, WikiGenes and GeneCard information about this gene | ||||
| RefSeq Summary | Summary of this gene | ||||
| Structure | Sequence | RNA | RNA sequences of this gene | N.A | N.A |
| Protein | Protein sequences of this gene | ||||
| Expression | BioGPS | N.A | A free extensible and customizable gene annotation portal, a complete resource for learning about gene and protein function. | N.A | |
| Allen Brain Microarray | N.A | Gene expression level analyzed from Allen Institute for Science Brain microarray analysis | N.A | ||
| Allen Brain ISH | N.A | N.A | In situ hybridization data | ||
| Regulation | PTM | Post-translational modification from Experimental and HMM Prediction | N.A | N.A | |
| NATs | cisNATs | N.A | cis-Natural Antisense Transcripts from NATsDB | ||
| transNATs | N.A | trans-Natural Antisense Transcripts from NATsDB | |||
| Variation | dbSNP | SNP information from NCBI dbSNP | SNP information from NCBI dbSNP and UCSC SNPs(130) track | N.A | |
| CNV | dbVar | Genomic structural variation from dbVar | N.A | N.A | |
| DGV | N.A | Genomic structural variation from Database of Genomic Variants | N.A | ||
| Phenotype and Disease | OMIM | N.A | Disease information from Online Mendelian Inheritance in Man | N.A | |
| GWAS | N.A | Genome-Wide Association Studies from NHGRI | N.A | ||
| GAD | N.A | Genetic association studies of complex diseases and disorders from Genetic Association Database | N.A | ||
| MGI | Marker | N.A | N.A | Marker from Mouse Genome Informatics | |
| Phenotypic Allele | N.A | N.A | Alleles and phenotypes from Mouse Genome Informatics | ||
| piggyBac | N.A | N.A | information derived from PB insertions (Insert) in the mouse genome with piggyBac transposon system | ||
| Function | RIF | NCBI Gene References Into Functions which offers publications documenting experiments that add to the understanding of the gene and its function | |||
| Pathway | KEGG | Pathway information from Kyoto Encyclopedia of Genes and Genomes | N.A | N.A | |
| PID | N.A | Biomolecular interactions and cellular processes from Pathway Interaction Database | N.A | ||
| Reactome | N.A | Pathway information from Reactome | N.A | ||
| InterPro | Predictive protein signatures used for the classification and automatic annotation of proteins and genomes from EBI InterPro | N.A | N.A | ||
| Protein-Protein Interaction | STRING | Protein interacting with protein of this gene and scores of eight predicting methods from Search Tool for the Retrieval of Interacting Genes/Proteins | N.A | N.A | |
| HPRD | N.A | Protein interacting with protein of this gene, reference and other related information | N.A | ||
| IntAct | N.A | Protein interacting with protein of this gene, publication, detection method and other related information | N.A | ||
| Gene Ontology | N.A | Gene Ontology Term related to this gene, including Biological Process, Cellular Component and Molecular Function | N.A | ||
| Drug | PharmGKB | Overview | N.A | Overview information about this gene | N.A |
| Related Gene | Genes related to this gene | ||||
| Related Pathway | Pathway this gene residents | ||||
| Related Drug | Drug related to this gene | ||||
| Related Disease | Disease related to this gene | ||||
| cMAP | N.A | Compound, Catalog Name and other information about the drug experiment on this gene | N.A | ||
Dataset Introduction
Summary
| Categories | Description |
|---|---|
| Entrez ID | NCBI Entrez Gene ID that is unique for certain gene |
| Offical Symbol | Nomenclature provided by the named external authority |
| Location | Chromosomal location of the gene, followed by the RefSeq chromosome and mRNA where the location comes from. The hyperlink to genome browser to view the genomic context was set |
| Type | Possible gene types in current RhesusBase release are protein-coding, pseudo, scRNA, snRNA, miscRNA, snoRNA and other. These are indexed as properties of a gene. More->> |
| Full Name | Full name of the gene, typically descriptions of the Offical Symbol |
| Lineage | Binomial and lineage from the Taxonomy database |
| RefSeq | Contains the RefSeq entries associated with the gene. Each group contains three RefSeq entries: the chromosome contig where the gene comes from, the RNA transcribed from the gene, the protein translated from the RNA. eg. : ( NW_001106399.1, XM_001094337.2, XP_001094337.2 ). More->> |
| Ensembl | Gene ID from Ensembl, a joint project between EMBL-EBI and the Wellcome Trust Sanger Institute to develop a software system which produces and maintains automatic annotation on selected eukaryotic genomes |
| UniGene | Cluster number from NCBI Unigene. Each UniGene entry is a set of transcript sequences that appear to come from the same transcription locus (gene or expressed pseudogene), together with information on protein similarities, gene expression, cDNA clone reagents, and genomic location |
| UniProt | Protein ID of UniProt, a database to provide the scientific community with a comprehensive, high-quality and freely accessible resource of protein sequence and functional information |
| Publications | Publication ID of PubMed, a literature database comprising more than 21 million citations for biomedical literature from MEDLINE, life science journals, and online books. It's citations may include links to full-text content from PubMed Central and publisher web sites |
| Wiki | The links to Wikipedia, WikiGenes and GeneCard.
"Wikipedia is a multilingual, web-based, free-content encyclopedia project based on an openly editable model. The name "Wikipedia" is a portmanteau of the words wiki (a technology for creating collaborative websites, from the Hawaiian word wiki, meaning "quick") and encyclopedia. Wikipedia's articles provide links to guide the user to related pages with additional information." (Cite from "Wikipedia:About") "WikiGenes is the first wiki system to combine the collaborative and largely altruistic possibilities of wikis with explicit authorship. In view of the extraordinary success of Wikipedia there remains no doubt about the potential of collaborative publishing, yet its adoption in science has been limited. Here I discuss a dynamic collaborative knowledge base for the life sciences that provides authors with due credit and that can evolve via continual revision and traditional peer review into a rigorous scientific tool." (Cite from the article "A wiki for the life sciences where authorship matters") "GeneCards is a searchable, integrated, database of human genes that provides concise genomic related information, on all known and predicted human genes." (Cite from "GeneCard") |
Structure
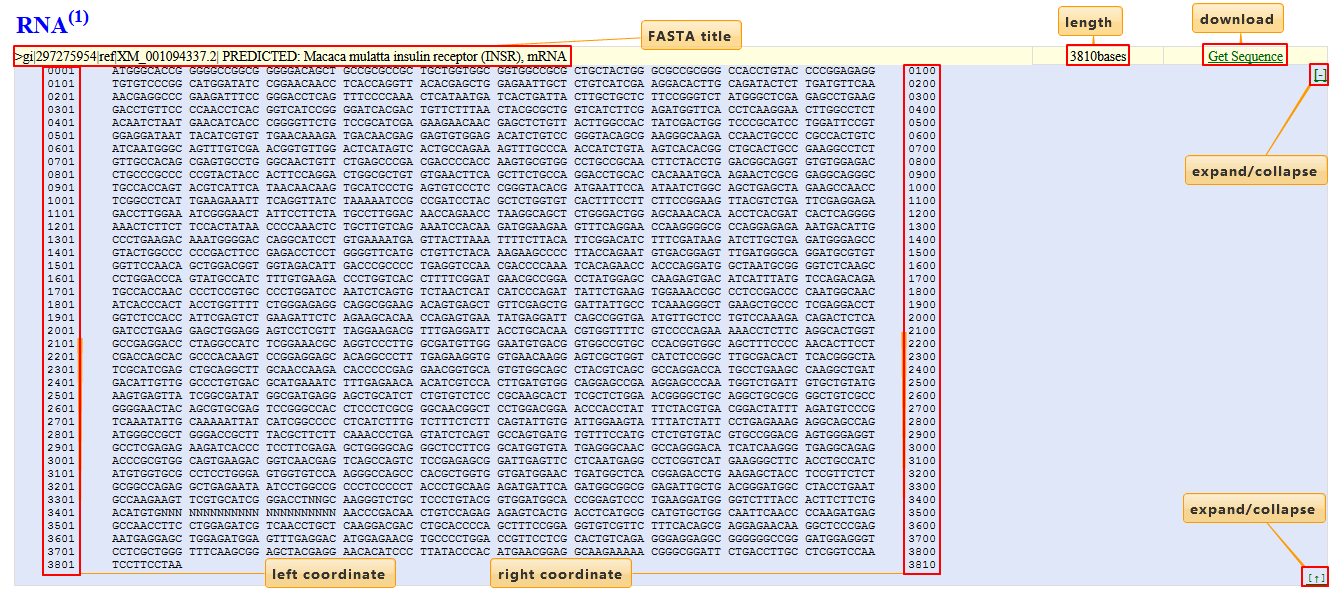
Sequence
RNA or protein sequences are presented in FASTA format. The sequence title, length and links to NCBI are shown. The coordinates flanking each sequence line indicates the positions of the first and last residues in the line.
Expression
MonkeyRNA-Seq
Several RNA-Seq datasets were analyzed and integrated, especially in-house strand-specific RNA-Seq data in ten rhesus macaque tissues. RhesusBase transcripts were used as the reference to estimate the expression levels in RPKM (Total reads mapped to exons of the transcript / (Total length in Kbp of exons of the transcript * Million Mapped reads)).
HumanRNA-Seq
RNA-Seq data were integrated from "Alternative isoform regulation in human tissue transcriptomes. Nature. 2008 Nov 27;456(7221):470-6.", "The evolution of gene expression levels in mammalian organs.Nature. 2011 Oct 19;478(7369):343-8." etc.. Raw RNA-Seq data in FASTQ format were re-analyzed and integrated with in-house pipelines. RefSeq transcripts were used as references to calculate gene RPKM.
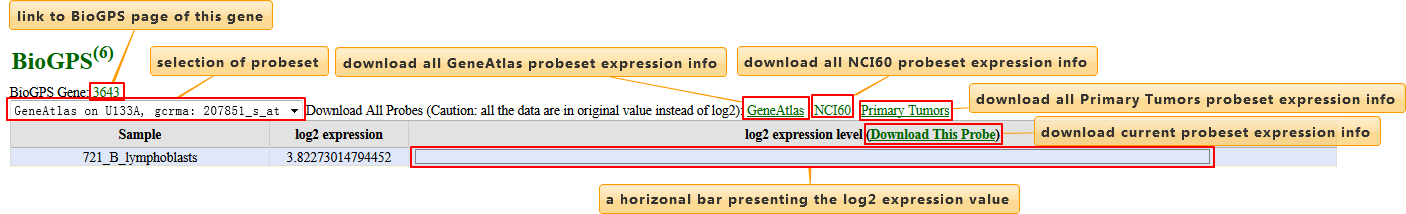
BioGPS
Expression data was integrated from BioGPS, a free extensible and customizable gene annotation portal.
| Column | Description |
|---|---|
| Sample | Tissue sample |
| log2 expression | Log2-transformed expression value |
| log2 expression level | Horizontal bar visualizing the log2-transformed expression value. Length of the bar of each sample was scaled so that the longest one fills up this column |
User may select different probe-sets to browse or download expression information. Attention: in the download file, it's the original expression values rather the log2-transformed counterparts showed on page.
Allen Brain Microarray
Data integrated from Microarray of Allen Brain Atlas. For graphic interpretation, please refer to BioGPS section.
| Column | Description |
|---|---|
| Structure | Name of brain regions, typically the top node for specific brain region on the "ontology tree of brain". |
| Ref. Structure | Representative sample for specific brain regions, selected on the basis of screening criteria as follows:
|
| RIN | The RNA Integrity Number (RIN) is calculated on the basis of an algorithm for assigning integrity values to RNA quality. The RIN algorithm is applied to electrophoretic RNA measurements and based on a combination of different features that contribute information about the RNA integrity to provide a more robust universal measure. |
| Ref. Donor | Donor of "Ref.Structure" |
| log2 intensity | Log2-transformed RNA expression intensity of "Ref.Structure" |
| log2 intensity level | Log2-transformed RNA expression intensity represented in bar charts. Length of the bar is normalized by the highest expression intensity and visualized based on the expression intensity |
Brain ISH
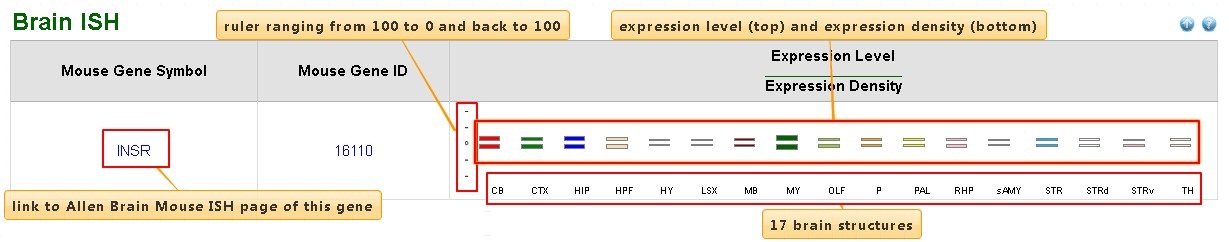
| Column | Description |
|---|---|
| Mouse Gene Symbol | Mouse gene symbol with hyperlinks to ISH gene pages in Allen Brain Atlas |
| Mouse Gene ID | Gene ID of mouse with hyperlinks to NCBI gene page |
| Mouse Gene Location | Mouse gene location in the format: <chromosome>:<start>-<end> |
| Expression Level ---------------------- Expression Density |
Vertical bars in up-panel and down-panel visualize the expression levels and expression densities, respectively. Values ranged from 0 to 100. Each brain region was arranged horizontally. For more detail, refer to Allen Brain Atlas database |
All data integrated from in situ hybridization data deposited in the Allen Brain Atlas database, a genome-wide, high-resolution atlas of gene expression throughout the adult mouse brain.
ISH data in 17 mouse brain regions were integrated:
- CB: Cerebellum
- CTX: Cerebral cortex
- HIP: Hippocampal region
- HPF: Hippocampal formation
- HY: Hypothalamus
- LSX: Lateral septal complex
- MB: Midbrain
- MY: Medulla
- OLF: Olfactory bulb
- P: Pons
- PAL: Pallidum
- RHP: Retrohippocampal region
- sAMY: Striatum-like amygdalar nuclei
- STR: Striatum
- STRd: Striatum dorsal region
- STRv: Striatum ventral region
- TH: Thalamus
Regulation
MonkeyPTM
Meta-data of this section were integrated from dbPTM, a database integrating experimentally verified Post-translational Modifications, as well as predicted PTMs on Swiss-Prot proteins.
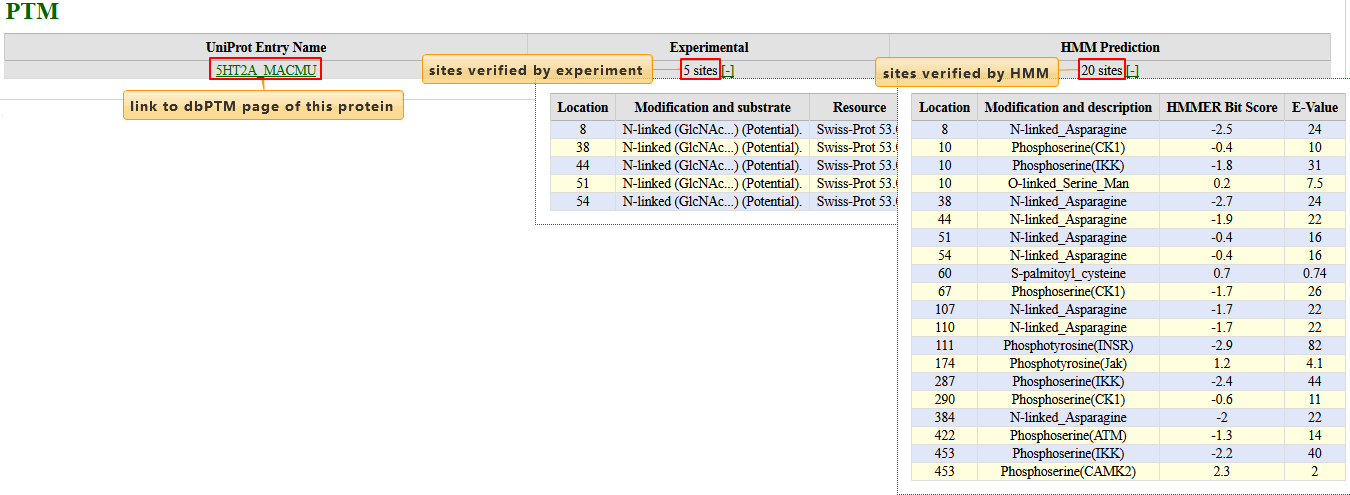
| Column | Description |
|---|---|
| UniProt Entry Name | The protein UniProt Entry Name with hyperlink to dbPTM Protein Information Page about this protein |
| Experimental | Quantity of Experimental Post-Translational Modification Sites. Please click [+] to expand details |
| HMM Prediction | Quantity of Predicted Post-Translational Modification Sites by profile HMM. Please click [+] to expand details |
| Column | Description |
|---|---|
| Location | Coordinate of the modified site on the protein |
| Modification and substrate | Modification type and its substrate. More>> |
| Resource | The original resource of the PTM |
| HMMER Bit Score | Bit Score and E-Value from HMMER. higher bit score and lower E-value indicate a more positive prediction |
| E-Value |
TFBS
UCSC liftOver tool was used to transform Transcription Factor Binding Sites location from hg19 to rheMac2 supported by experimental ChIP-Seq data from ENCODE Project. TFBS overlapping upstream 10kbp of a gene were taken as its TFBS.
miRNA Target
miRNA target prediction software PicTar, miRanda and targetScan were used to predict miRNA target on human RefSeq RNA followed by AGO CLIP-Seq data filtering. UCSC LiftOver was used to transform human target sites to monkey genome with a minimal requirement of 0.5 phastCons conservation score.
HumanNATs
"NATs" (Natural Antisense Transcripts) are RNAs that are at least partially complementary to other endogenous RNAs. They might be transcribed in cis from opposing DNA strands at the same genomic locus (cisNATs) or in trans at separate loci (transNATs)."
We have integrated meta-data of cisNATs from NATsDB and transNATs from Trans-SAMap.
cisNATs
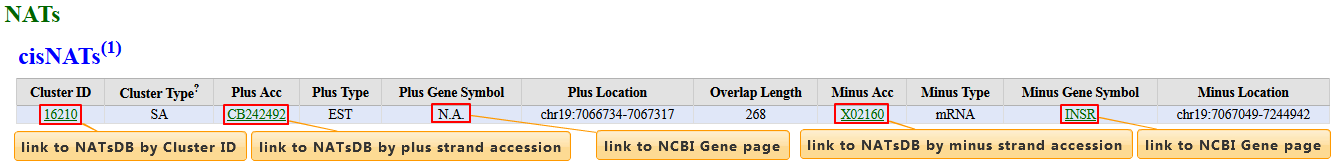
| Column | Description |
|---|---|
| Cluster ID | NATsDB Cluster ID |
| Cluster Type | Cluster categories related to cis-NATs, named SA (Sense-Antisense pair) and NOB (Non-exon-Overlapping Bidirectional) |
| Plus Acc | Accession number of cis partner that can be aligned to plus strand |
| Plus Type | "Plus Acc" type, such as EST and mRNA |
| Plus Gene Symbol | Gene symbol on the locus plus partner |
| Plus Location | Location of plus partner |
| Overlap Length | Overlap length between two cis partners |
| Minus Acc | Accession number of cis partner that can be aligned to minus strand |
| Minus Type | "Minus Acc" type, such as EST, mRNA |
| Minus Gene Symbol | Gene symbol on the locus minus partner |
| Minus Location | Location of minus partner |
transNATs
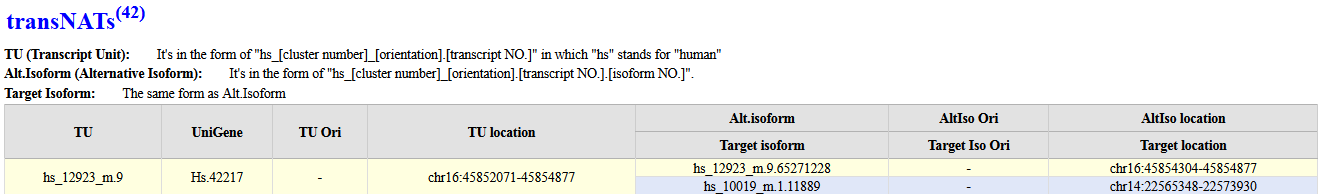
| Column | Description |
|---|---|
| TU |
Transcript Unit. Take the abbreviation of "hs_0_m.0" as an example
|
| UniGene | UniGene cluster ID where the TU comes from |
| TU Ori | Orientation of TU |
| TU location | TU genome location |
| Alt.isoform | Alternative isoform ID of TU. These transcripts are predicted by SVAP. The last ".number", like ".118692", is a marker of transcript. ".118692" means one alternative isoform of transcript units other than the 118,692nd isoform of this transcript unit. This is a random number other than sorted number. Different transcripts from a gene have different IDs |
| AltIso Ori | Orientation of alternative isoform |
| AltIso location | Location on genome of alternative isoform |
| Target isoform | Like alternative isoform, but target isoform rather alternative isoform |
| Target Iso Ori | Orientation of target isoform |
| Target location | Location on genome of target isoform |
NATs
Refer to Human NATs
Variation
MonkeydbSNP
All meta-data was integrated from NCBI dbSNP.

| Column | Description | ||||||||||||||||||||||||||||||||
|---|---|---|---|---|---|---|---|---|---|---|---|---|---|---|---|---|---|---|---|---|---|---|---|---|---|---|---|---|---|---|---|---|---|
| RefSNP ID | SNP reference ID | ||||||||||||||||||||||||||||||||
| Location | SNP Genomic location | ||||||||||||||||||||||||||||||||
| Alleles | SNP Alleles | ||||||||||||||||||||||||||||||||
| IUPAC | Alleles defined by the International Union of Pure and Applied Chemistry (IUPAC). It could be:
|
||||||||||||||||||||||||||||||||
| Variation Class | SNP Variation class including "Strict SNP", "Insertion/deletion variation", "Unclassified heterozygous variations", "Microsatellite", "Named variation without allele sequence", "No variation", "Mixed variations" or "Multinucleotide polymorphism" | ||||||||||||||||||||||||||||||||
| Molecule Type | Type of the molecule from which this SNP is validated | ||||||||||||||||||||||||||||||||
| UpStream | Click the [+] to display upstream sequence of this SNP | ||||||||||||||||||||||||||||||||
| DownStream | Click the [+] to display downstream sequence of this SNP |
CNV
CNVs (Copy-number variations)--a form of structural variation--are alterations of the DNA of a genome that results in the cell having an abnormal number of copies of one or more sections of the DNA. CNVs correspond to relatively large regions of the genome that have been deleted (fewer than the normal number) or duplicated (more than the normal number) on certain chromosomes. For example, the chromosome that normally has sections in order as A-B-C-D might instead have sections A-B-C-C-D (a duplication of "C") or A-B-D (a deletion of "C"). (cite Wikipedia "Copy-number variation")
dbVar
dbVar is a NCBI database of genomic structural variation.
All meta-data were integrated from nstd3 study in the publication of Lee et al. 2008. If the location of structural variant overlaps with the gene location, the structural variant was considered as the structural variant of the gene.

| Column | Description |
|---|---|
| Variant Acc | dbVar Variant accession ID |
| Location (0-based) | Variant genomic location |
| Method Type | Variant detection method |
| Validation | Whether the variant was validated |
| Allele Type | Allele type of variant call |
dbSNP
All meta-data were integrated from NCBI dbSNP and UCSC SNPs130 track.

| Column | Description |
|---|---|
| RefSNP ID | dbSNP Reference SNP ID |
| Location (1-based) | SNP genomic location |
| Strand | DNA strand where alleles observed |
| refNCBI | Reference genomic sequence from dbSNP |
| refUCSC | Reference genomic sequence from UCSC lookup of chrom, chromStart, chromEnd |
| Alleles | The sequences of the observed alleles from rs-fasta files |
| Molecule Type | Sample type from exemplar submitted sequence (ss) |
| Class | Class of variant (single, in-del, named, mixed, etc.) |
| Valid | Validation status of the SNP |
| Function | Functional category of the SNP (coding-synon, coding-nonsynon, intron, etc. Only SNPs with function of coding-synon, nonsense, missense and frameshift were collected in RhesusBase!) |
| LocType | Type of mapping inferred from size on reference; may not agree with class |
CNV
DGV
DGV (Database of Genomic Variants) is a database that provides a comprehensive summary of structural variation in the human genome. It defines structural variation as genomic alterations that involve segments of DNA that are larger than 50bp. DGV only represents structural variations identified in healthy control samples..

| Column | Description |
|---|---|
| Variation ID | Variation ID assigned to every record in the DGV |
| Landmark (1-based) | Physical position of a record based on coordinates, clones, genes, or other features for which a physical position can be established. All coordinates are currently based on May 2004 (NCBI Build35) Assembly of the Human Genome |
| Human location (1-based) | Genomic location where the variant located |
| PubMed | PubMed ID for the study from which the information is extracted |
| Method/Platform | The method by which the variation is discovered/characterized |
| Frequency | Allele Frequency |
There is no available variation information about Mouse in the current release of RhesusBase.
Phenotype and Disease
MonkeyThere is no available phenotype and disease information about Monkey in the current release of RhesusBase.
HumanOMIM
"OMIM (Online Mendelian Inheritance in Man) is a comprehensive, authoritative, and timely compendium of human genes and genetic phenotypes. The full-text, referenced overviews in OMIM contain information on all known mendelian disorders and over 12,000 genes. OMIM focuses on the relationship between phenotype and genotype. " (cite NCIB OMIM)

| Column | Description |
|---|---|
| OMIM Number | OMIM ID |
| Location | OMIM gene location on monkey genome transformed from human by liftOver |
| Human Location | OMIM gene location on huan genome |
| Chr Band | Human chromosome band |
| Title | OMIM gene title |
| Disorder | Disorder associated with the OMIM gene |
| Method | The method for mapping genes. More>> |
GWAS
"GWAS (The genome-wide association study) publications listed here include only those attempting to assay at least 100,000 single nucleotide polymorphisms (SNPs) in the initial stage. Publications are organized from most to least recent date of publication, indexing from online publication if available. Studies focusing only on candidate genes are excluded from this catalog." (cite NHGRI GWAS Catalog)
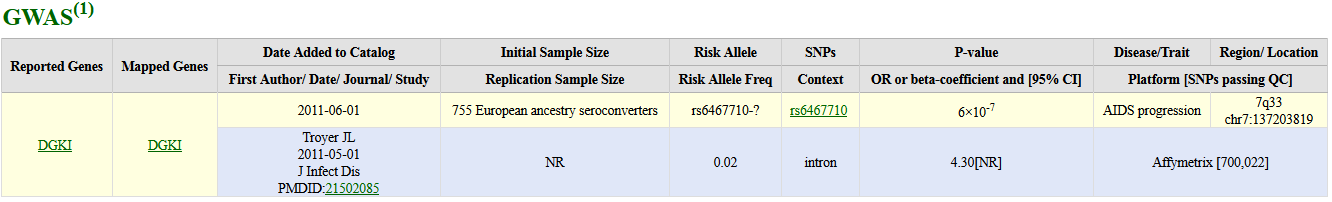
| Column | Description |
|---|---|
| Reported Genes | Reported Genes |
| Mapped Genes | Mapped Genes |
| Date Added to Catalog | Date Added to Catalog |
| First Author/ Date/ Journal/ Study | First author/Date/Journal of publication and PubMed ID of publication of the study |
| Initial Sample Size | Initial sample size |
| Replication Sample Size | Replication sample size |
| Risk Allele | Strongest SNP-Risk Allele |
| Risk Allele Freq | Risk Allele Frequency |
| SNPs | ID of SNP associated with trait |
| Context | Context of the SNP |
| P-value | P-Value |
| OR or beta-coefficient and [95% CI] | Odds ratio or beta and 95% Confidence Interval |
| Disease/Trait | Disease or trait assessed in study |
| Region/ Location | Chromosome band / location of SNP |
| Platform [SNPs passing QC] | Platform and [SNPs passing QC] |
GAD
GAD (The Genetic Association Database) is an archive of human genetic association studies of complex diseases and disorders. This includes summary data extracted from published papers in peer reviewed journals on candidate gene and GWAS studies. (cite GAD)

| Column | Description |
|---|---|
| GAD ID | GAD ID |
| Disease Class | Disease Class |
| OMIM ID | OMIM ID associating with this disease |
| Human Gene ID | Human Entrez Gene ID associated with this disease |
| PubMed | PubMed ID associated with this disease |
| rs Number | dbSNP ID |
MGI
MGI (Mouse Genome Informatics) is the international database resource for the laboratory mouse, providing integrated genetic, genomic and biological data to facilitate the study of human health and disease.
Marker
Marker provides basic detail of gene and associated diseases with mutation alleles related to corresponding gene.
Phenotypic Allele
The Phenotypic allele project enables access to spontaneous, induced, and genetically-engineered mutations and their strain-specific phenotypes. Phenotypic alleles related to the gene were integrated with hyperlink to MGI website.
piggyBac
All meta-data were integrated from PBmice.
The TTAA-specific transposon piggyBac is rapidly becoming a highly useful transposon for genetic engineering of a wide variety of species, particularly insects. piggyBac provides information related to piggyBac in particular, and its uses for transgenesis in general. (cite piggyBac)

| Column | Description |
|---|---|
| Symbol | Gene Symbol |
| Insert Name | Name of insertion sequence |
| Strain | Strain |
| Chr | Chromosome Number |
| Pos | Position |
| Line Name | Line Name |
Function
MonkeyRIF
GeneRIF (Gene Reference Into Function) provides a simple mechanism for scientists to add to the functional annotation of Entrez Gene. It is intended to facilitate access to publications documenting experiments that add to the understanding of a gene and its function. References related to the function of gene in Monkey were provided.
Pathway
KEGG
KEGG (Kyoto Encyclopedia of Genes and Genomes) is a bioinformatics resource for linking genomes to life and the environment, providing a collection of online databases dealing with genomes, enzymatic pathways, and biological chemicals. Map, pathway, compound, drug and glycan information related to the gene were provided.
InterPro
InterPro is a database of protein families, domains and functional sites in which identifiable features found in known proteins can be applied to new protein sequences in order to functionally characterise them. The information related to the gene was provided as follows: Domain predicted by IntreProScan, Signatures to other domain database, GO terms assigned to the domain and PDB entries of the domain.
Protein-Protein Interaction
STRING
STRING (Search Tool for the Retrieval of Interacting Genes/Proteins) is a database of known and predicted protein interactions. The interactions include direct (physical) and indirect (functional) associations; they are derived from four sources: Genomic Context, High-throughput Experiments, (Conserved) Coexpression, Previous Knowledge..
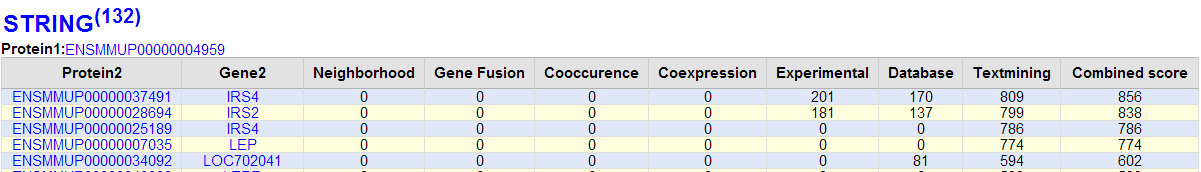
| Column | Description |
|---|---|
| Protein2 | Ensembl protein ID interacting with protein of the gene |
| Gene2 | Symbol of gene encoding "Protein2" |
| Neighborhood | Neighborhood score computed from the inter-gene nucleotide count |
| Gene Fusion | Gene Fusion score derived from fused proteins in other species |
| Concurrence | Concurrence score of the phyletic profile derived from similar absence/presence patterns of genes |
| Coexpression | Coexpression score derived from similar pattern of mRNA expression measured by DNA arrays and similar technologies |
| Experimental | Experimental score derived from experimental data, such as, affinity chromatography |
| Database | Database score derived from curated data of various databases |
| Textmining | Textmining score derived from the co-occurrence of gene/protein names in abstracts |
| Combined score | Combined score computed by combining the probabilities from the different evidence channels, correcting for the probability of randomly observing an interaction |
All above scores were scaled into 0-1000.
HumanRIF
The section shows total references related to the function of the gene in Human. For more details about RIF, please refer to RIF in Monkey.
Gene Ontology
The Gene Ontology project is a major bioinformatics aiming at standardizing the representation of gene and gene product attributes across species and databases. The project provides a controlled vocabulary of terms for describing gene product characteristics, its annotation data from GO Consortium members, as well as tools to access and process this data.
The cellular component ontology describes locations, at the levels of subcellular structures and macromolecular complexes. Examples of cellular components include nuclear inner membrane, with the synonym inner envelope, and the ubiquitin ligase complex, with several subtypes of these complexes represented.
The molecular functions of a gene product are the jobs that it does or the "abilities" that it has. These may include transporting things around, binding to things, holding things together and changing one thing into another. This is different from the biological processes the gene product is involved in, which involve more than one activity.
A biological process is a recognized series of events or molecular functions. A process is a collection of molecular events with a defined beginning and end. Mutant phenotypes often reflect disruptions in biological processes. (Cite GO)
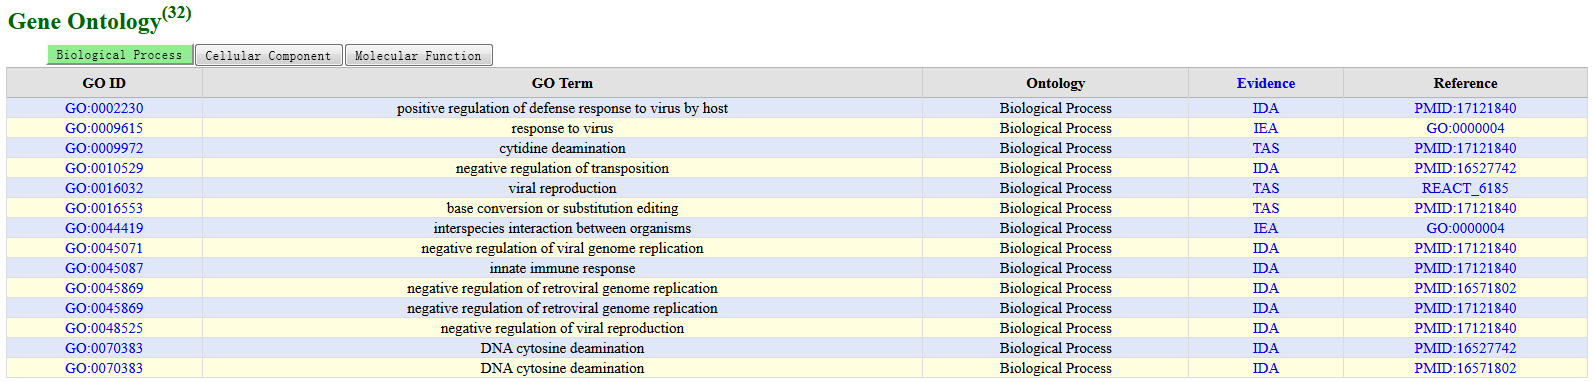
| Column | Description |
|---|---|
| GO ID | Gene Ontology ID |
| GO term | Terms for describing gene product characteristics and annotation data from GO Consortium |
| Ontology | Biological Process/Cellular Component/Molecular Function |
| Evidence | Evidence supporting the annotations |
| Reference | Reference associating to certain GO ID |
Pathway
PID
PID (The Pathway Interaction Database) is a highly-structured, curated collection of information about known biomolecular interactions and key cellular processes assembled into signaling pathways. ID and name of pathways in which the corresponding gene involved were provided.
Reactome
REACTOME is an open-source, open access, manually curated and peer-reviewed pathway database. Names of associated pathway of gene are provided.
Protein-Protein Interaction
HPRD
HPRD (The Human Protein Reference Database) represents a centralized platform to visually depict and integrate information pertaining to domain architecture, post-translational modifications, interaction networks and disease association for each protein in the human proteome. Information of interactor with gene are provided, such as interactor symbol, interactor name, experiment type and so forth.
IntAct
IntAct provides a freely available, open source database system and analysis tools for protein interaction data.
MouseRIF
There is no available function information about Mouse in the current release of RhesusBase.
Drug
MonkeyThere is no available drug information about Monkey in the current release of RhesusBase.
HumanPharmGKB
PharmGKB (Pharmacogenomics Knowledge Implementation.) is a comprehensive resource that curates knowledge about the impact of genetic variation on drug response for researchers and clinicians. Encompass clinical information were encompassed, including dosing guidelines and drug labels, potentially clinically actionable gene-drug associations and genotype-phenotype relationships (cite PharmGKB). Information related to the gene was provided as follows: overview information, gene related to the corresponding gene, pathway in which corresponding gene is involved, related drug and related disease.
cMAP
cMAP (Connectivity Map) is a collection of genome-wide transcriptional expression data from cultured human cells treated with bioactive small molecules and simple pattern-matching algorithms that together enable the discovery of functional connections between drugs, genes and diseases through the transitory feature of common gene-expression changes. Basic information of related small molecules from ChemBank in cMAP was provided. The compound were classified into two categories by expression fold change (FC). FC >=2 is considered as up-regulation compound and <=0.5 as down-regulation one.
MouseThere is no available drug information about Mouse in the current release of RhesusBase.