


In the framework of well-defined gene structures, we integrated in-house generated monkey functional genomics data, as well as public available monkey data scattered in literatures and specialized databases, to develop a Genome Browser on the basis of ABrowse.
We re-analyzed the raw data and designed standardized criteria for meta-data extraction and storage. Tons of functional genomics data in rhesus macaque especially using the deep sequencing technology were integrated into the Genome Browser. Detailed meta-data such as sample information, types of experimental platforms and treatments, literature information, genotype-phenotype correlation information were carefully curated and integrated. Through the PubMed keywords query, we accessed all functional genomics studies in rhesus macaque, such as high-throughput annotations on gene expression profiles, transcription factor and microRNA binding sites generated by deep sequencing-based RNA-Seq, ChIP-Seq and CLIP-Seq technology. In addition, for each site in the monkey genome, we calculated cross-species conservation scores to facilitate rhesus macaque-centric comparative genomics studies.
More than 110 functional tracks were added onto the corresponding genomic context, illustrating refined gene and transcript structures, mRNA and EST data, RNA-Seq expression tags coverage and splicing junctions, transcription regulations, comparative genomics, variation and repeats, as well as phenotype and disease associations.
- Generally Browse
- Top Navigator
- Quick Search
- Advanced Search
- Track Options
- Create Landmark
- Chromosomal Ruler
- Right-side Panel
- Current Tracks
- Entry Detail
- My Landmark
- My Blat
- My Tracks
- Main Window
- Navigator Panel
- View Panel
- Track Container
- Top Navigator
- User Registration and User Space
- Add Comment for Entry
- Make Evaluation for Track
- Upload & Manage My Tracks
- "Landmark" Record
- Sequence Query Result Record
- Tracks
- Mapping
- CH SNP
- Phenotype and Disease Associations
- GAD
- OMIM Genes
- GWAS
- Genes and Gene Prediction
- RhesusBase Genes
- Ensembl Genes
- RefSeq Genes
- SGP Gene Predictions
- Geneid Gene Predictions
- NSCAN Gene Predictions
- miRNA Genes
- tRNA
- mRNA and EST
- mRNA
- Spliced EST
- EST
- Other mRNA
- RhesusBase Junctions
- Other Publication Junctions
- RNA-Seq (IMM)
- RNA-Seq (Other)
- Regulation
- TSS
- CpG Island
- NHGRI BiPromoter
- Comparative Genomics
- 6way conservation
- 9way conservation
- Chain
- Net
- Variation and Repeats
- dbSNP
- RepeatMasker
- Simple Repeats
- CNV from DGV
- CNV from dbVar
- Mapping
Generally Browse
The browser supports different searching methods for quick access to interesting tracks and provides a rapid and reliable display of any requested genomic region at multiple scales. Dozens of annotation tracks can be shown in the center panel according to specific user requirements.
Top Navigator
A navigation bar at the top of the browser allows users to search and configure tracks of interest quickly and easily.

Quick Search
"Quick Search" is the default tab on the search panel. To search for a track, enter search terms (chromosome location and species) into the box, then click "GO!"
Advanced Search
The "Advanced Search" allows users to search for browser by three manners:
- Location Information: input the location information in the format of "chr:start-end" or "chr: start+length" for quick localization.
- Fasta Format Sequences: Do alignment against monkey genome with sequence in FASTA format using BLAT. The result shows the highest identical hit(s) in sub-window. Users can also view the result on center panel by clicking "view". The result is recorded in "My Blat" on the "Righ-side Panel" (described below).
- Keyword: Search track features like "id" with exact match and return hit(s) with hyperlink to corresponding genomic context.

Track Options
Dozens of annotation tracks are prepared in the Track Options (RhesusBase transcript structure, RefSeq genes, ESTs, mRNAs, CpG islands, etc.). The options correspond to the track clusters shown in the browser. Three display models are provided in normal view: general, dense and hide. The dense view shows the first entry of all entries presented in general view. Two display models are provided in basepair view: basepair and hide.
Create Landmark
If users are interested in one particular region or tracks, navigate to the region with the wanted tracks open then click "create landmark" to create landmark facilitating return this region next time. The landmark will be stored in "my landmark" on the right-side panel (described below). By clicking on the name of the landmark users created, users will be led to the corresponding region.
Chromosomal Ruler
The chromosomal ruler below the top navigator offers a quick and visualized locating in a specific region of the genome by clicking the corresponding location on it (compatible with FireFox, but not with IE).
Right-side Panel

Current Tracks
Show basic information of tracks displayed on the center panel.
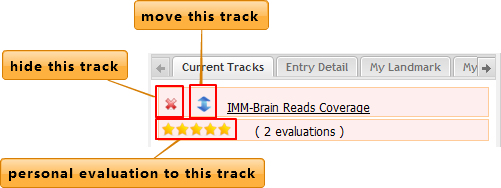
Users can hide the tracks and change the order of tracks displayed on the screen by clicking the buttons shown as above. In order to move the tracks for convenient comparison, users need to drag the up-down button and move the information line to the desired place. Evaluations can be made to any tracks if signed in.
Entry Detail
Show detailed information of the designated region and a brief description about the track in which the region is located.
My Landmark
Record of searching results of "Create Landmark" on top navigator.
My Blat
Record of searching results of "Fasta Format Sequence" in advanced searching on top navigator.
My Tracks
Record of tracks users uploaded.
Main Window
Navigator Panel
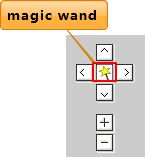
At the top left corner of the center panel, navigation arrows are prepared for users to move the current screen in different directions. Zoom in or out of the current tracks by clicking "+" or "-". Users can use the magic wand in the middle of the navigation arrows to select one region of a track and zoom in in the main canvas or in a sub window. (Click the magic wand to active selecting status, then click a point on the center panel as the start point and release the mouse. Now click another point and the rectangle area between the two points is selected). A context menu will be showed for view and window choice.
View Panel
At the top right corner of the center panel, two buttons are provided for users to switch between "normal view" and "basepair view" conveniently.
Track Container
Show graphic information of tracks in browser.
User Registration and User Space
RhesusBase provides user space for customized data. By clicking the "Register Now" in the navigation bar, a registration page appears. After successful registration by filling in the required information, click on the "Sign In" to log in.
Add Comment for Entry
User can add comments for entries with private/public privilege. Public comments are visible among all users while private comments serve as personal online work notes.
Make Evaluation for Track
RhesusBase allows user to make track evaluation by adding stars and comments. One user can add comments many times but only once for star evaluation.
Upload & Manage My Tracks
User can freely upload data from web interface by setting the track name, genome name, file format, privilege and file path. Uploaded tracks will be listed in the "My Tracks" tab and the bottom of Current Track tab.
"Landmark" Record
Recording browsing status as a "landmark" allows for jumping to preserved important analysis status. RhesusBase also supports sharing landmark with specified users (Under construction).
Sequence Query Result Record
Sequence search results for guest are saved in the My Blat tab temporarily, but for registered user permanently.
Tracks
Mapping
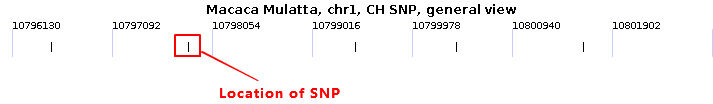
CH SNP
This track shows SNPs mapped from CMSNP (Chinese Macaque within the Chinese Macaque SNP) database, which organizes rhesus macaque sequence variation data.
Phenotype and Disease Associations
GAD

This track shows the genomic positions of gene entries covered by GAD (Genetic Association Database), a gene-centered archive of human genetic association studies of complex diseases and disorders. liftOver was used to transform the GAD location from human to monkey.
Entry detail information was provided as follows:
| Feature | Description |
|---|---|
| id | GAD ID |
| chr | Reference sequence chromosome |
| start | GAD region start position on genome |
| end | GAD region end position on genome |
| strand | + or - for strand |
| length | =end-start |
OMIM Genes
This track shows the genomic positions of all gene entries in the OMIM (Online Mendelian Inheritance in Man) database. The mappings displayed in this track are based on OMIM gene entries, their Entrez Gene IDs, and the corresponding RefSeq Gene locations.
GWAS
This track shows SNP-trait associations in GWAS (genome-wide association study) publications.
Genes and Gene Prediction
RhesusBase Genes

RNA-Seq data were analyzed with in-house pipelines and used to revise and assemble the monkey transcript structure. Powerful evaluations were carried out and the reasonable revised structure was confirmed.
Entry detail information is provided as follows:
| Feature | Description |
|---|---|
| id | Transcript ID. For RhesusBase Genes, it's composed of "IMMRT1" and ten digitals. The first five ones refer to boundary refined, new exon, 5'UTR extended, 3'UTR extended and new transcript, respectively, when set to "1". The remaining five ones are the serial number associated with chromosome coordinate. |
| chr | Reference sequence chromosome or scaffold |
| start | Unsigned range Transcription start position |
| end | Unsigned range Transcription end position |
| strand | Strand of transcript (either '+' or '-') |
| length | =end-start |
| block_count | Number of blocks |
| block_start | Block start positions |
| block_end | Block end positions |
| block_size | Block sizes (equal to block-end-block_start) |
| block_frame | Block frame {0,1,2}, or -1 if no frame for exon |
| block_type | Five_prime_UTR/CDS/ three_prime_UTR |
| score | Range score |
| attribute | Additional information separated by semicolon.
|
Ensembl Genes
This track shows gene predictions generated by Ensembl. For a description of the methods used in Ensembl gene prediction, please refer to Hubbard, T. et al. (2002). Ensembl transcripts displayed are products of the Ensembl automatic pipeline, termed the Ensembl genebuild.
RefSeq Genes
This track shows known protein-coding and non-protein-coding genes taken from the NCBI RNA RefSeq (reference sequences) collection. The RefSeq collection is a freely accessible database of naturally occurring DNA, RNA, and protein sequences.
SGP Gene Predictions
This track shows gene predictions from the SGP program developed at the Genome Bionformatics Laboratory (GBL).
Geneid Gene Predictions
This track shows gene predictions from the geneid program developed at the Genome Bionformatics Laboratory (GBL). Please follow the hyperlink for more information about geneid.
NSCAN Gene Predictions
This track shows gene predictions using the N-SCAN gene structure prediction software provided by the Computational Genomics Lab at Washington University in St. Louis, MO, USA.
miRNA Genes
This track shows miRNA gene predictions based on the miRBase database.
tRNA
This track shows tRNA gene predictions made by the program tRNAscan-SE on complete or nearly complete genomes. Data come from Genomic tRNA Database.
mRNA and EST
mRNA
This track shows alignments between rhesus mRNAs in GenBank and the genome
Spliced EST
This track shows alignments between rhesus monkey expressed sequence tags (ESTs) in GenBank and the genome, showing signs of splicing when aligned to the genome.
Compared with EST track, a spliced EST must show evidence of at least one canonical intron, i.e. the genomic sequence between EST alignment blocks must be at least 32 bases in length and have GT/AG ends.
EST
This track shows alignments between rhesus monkey expressed sequence tags (ESTs) in GenBank and the genome, including spliced and non-spliced ESTs.
Other mRNA
This track displays alignment result (using Blat) of vertebrate and invertebrate mRNA in GenBank from organisms other than rhesus.
RhesusBase Junctions
This track shows alignments between the genome and junctions estimated by next-generation sequencing mapping tools with in-house RNA-Seq data.
Other Publication Junctions
This track shows alignments between the genome and junctions estimated by next-generation sequencing mapping tools with public RNA-Seq data, including Nature (2008,2011), Nature Biotechnology, Genome Research, PCB, JD and Yi).
RNA-Seq (IMM)
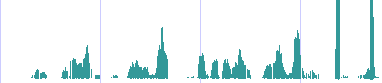
This track shows reads coverage of in-house RNA-Seq data mapping result of ten monkey tissues. In dense view, the higher score a region has, the higher reads coverage it indicates. The top limit of reads coverage is no more than one hundred reads, and the off-limit isn't shown on the screen.
Entry detail information was provided as follows:
| Feature | Description |
|---|---|
| CHR | Reference sequence chromosome |
| START | Start position of a region with continuous identical coverage |
| LENGTH | Length of a region with continuous identical coverage |
| SCORE | Coverage of a region |
RNA-Seq (Other)
Reads Coverage of RNA-Seq data from Nature, Nature Biotechnology, Genome Research, PCB, JD, Yi...
Regulation
TSS
This track shows transcription start sites in the rhesus genome, by methods described in " Ab initio identification of transcription start sites in the Rhesus macaque genome by histone modification and RNA-Seq. Nucl. Acids Res. (2010) doi: 10.1093/nar/gkq956."
CpG Island
This track shows regions of CpG islands, where CpGs are present at significantly higher levels than is typical for the genome as a whole. Following attributes were integrated:
| Feature | Description |
|---|---|
| cpgNum | Number of CpGs in island |
| gcNum | Number of C and G in island |
| perCpg | Percentage of island that is CpG |
| perGc | Percentage of island that is C or G |
| obsExp | Ratio of observed(cpgNum) to expected(numC*numG/length) CpG in island |
NHGRI BiPromoter
This track shows regions of NHGRI bidirectional promoters from NCBI. Bidirectional promoters are regulatory regions that fall between pairs of genes with an ability to regulate two downstream genes (divergent genes).
TFBS
UCSC liftOver tool was used to transform Transcription Factor Binding Sites location from hg19 to rheMac2 supported by experimental ChIP-Seq data from ENCODE Project.
miRNA Target
The miRNA target prediction software PicTar, miRanda and targetScan were used to predict miRNA target on human RefSeq RNA followed by AGO CLIP-Seq data filtering. UCSC LiftOver was used to transform human RefSeq RNA to monkey genome with a cut-off of 0.5 phastCons conservation score to gain miRNA target on monkey genes
Comparative Genomics
6way conservation
Conservation prediction score among 6 species including Human (hg18), Chimp (panTro2), Gorilla (gorGor3), Orangutan (ponAbe2), Rhesus (rheMac2) and Marmoset (calJac3) are provided. phastCons conservation score predicts region conservation and mostCons predicts most conserved elements from phastCons, while phyloP conservation score predicts basewise conservation. The predicting procedure starts with pairwise alignments between monkey and 5 species, respectively, data of which are downloaded from UCSC. Then the main tools including multiz, a multiple alignment tool, phastCons, a conservation predicting tool and phyloP, a basewise conservation predicting tool, were used successively to calculate the conservation prediction score.
9way conservation
The same with 6way, but three more species were involved to predict conservation, which were Mouse (mm8), Rat (rn4) and Opossum (monDom5).
Chain
This track shows alignments of monkey to other genomes using a gap scoring system that allows longer gaps than traditional affine gap scoring systems. The chain track displays boxes joined together by either single or double lines. The boxes represent aligning regions.
Net
The net track shows the best monkey/other chain for every part of the other genome. It is useful for finding orthologous regions and for studying genome rearrangement.
Variation and Repeats
dbSNP
This track shows short genetic variations, mostly single base variation, from NCBI dbSNP database.
RepeatMasker
This track shows interspersed repeats and low complexity DNA sequences using Arian Smit's RepeatMasker program. The program outputs a detailed annotation of the repeats that are present in the query sequence represented by this track. RepeatMasker uses the Repbase Update library of repeats from the Genetic Information Research Institute (GIRI).
This track displays up to ten different classes of repeats:
- Short interspersed nuclear elements (SINE), which include ALUs
- Long interspersed nuclear elements (LINE)
- Long terminal repeat elements (LTR), which include retroposons
- DNA repeat elements (DNA)
- Simple repeats (micro-satellites)
- Low complexity repeats
- Satellite repeats
- RNA repeats (including RNA, tRNA, rRNA, snRNA, scRNA, srpRNA)
- Other repeats, which includes class RC (Rolling Circle)
- Unknown
A "?" at the end of the "Family" or "Class" (for example, DNA?) signifies that the curator was unsure of the classification. At some point in the future, either the "?" will be removed or the classification will be changed.
Simple Repeats
This track displays simple tandem repeats (possibly imperfect repeats) located by TRF (Tandem Repeats Finder). These repeats can occur within coding regions of genes and may be quite polymorphic. Repeat expansions are sometimes associated with specific diseases.
CNV from DGV
This track displays copy number variations from DGV (Database of Genomic Variants).
CNV from dbVar
This track displays copy number variations from dbVar (Database of genomic structural variation ).